2026/2/28
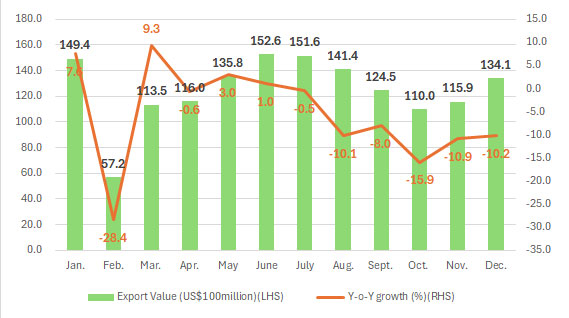
In 2025, amid profound shifts in the international environment, significant challenges to the global trading order, and heightened supply chain risks, China’s apparel foreign trade sector demonstrated notable resilience. According to China Customs statistics, from January to December 2025, China’s total apparel exports (including clothing accessories, unless otherwise noted) amounted to US$151.2 billion, a year-on-year decline of 5% (see Figure). Apparel imports totaled US$10.2 billion, down 2.3% year-on-year. The trade surplus stood at US$141.02 billion, a 5.2% decrease compared to 2024.
Figure: Monthly Performance of China’s Apparel Exports in 2025
I. Export Performance
Breaking down apparel exports by quarter in 2025, the first quarter saw significant fluctuations due to the Spring Festival holiday, with exports falling 1.9% year-on-year. And the second quarter saw relatively stable export performance, with a modest 1.2% year-on-year increase. In the second half of the year, exports declined consistently: the third-quarter figure dropped 6.2% year-on-year, and the decline widened to 12.2% in the fourth quarter.
Cotton Apparel Suffered Sharper Declines
From January to December 2025, knitwear exports reached US$69.88 billion, down 4.3% year-on-year, though export volume rose by 3.9% to 24.42 billion pieces. Woven apparel exports totaled US$61.52 billion, down 5.6%, with volume up 3.7% to 14.53 billion pieces. Clothing accessories exports amounted to US$15.03 billion, down 4.2%.
By fiber type, cotton apparel saw steeper declines than synthetic-fiber apparel. Cotton knitwear and woven apparel exports fell by 9.3% and 6.6%, respectively. Synthetic knitwear and woven apparel exports declined by 1.7% and 5.5%, respectively.
Underwear Experienced the Largest Drop
Except for a marginal 0.1% increase in sweater exports, all other major apparel categories recorded declines. Underwear led the downturn: brassiere exports dropped 11.8%; underwear/sleepwear exports fell 10.7%. Dresses and knitted T-shirts declined by 10.8% and 8.9%, respectively.
Exports to the EU and Japan Grew; Those to the U.S. and ASEAN Continued to Slide
• Exports to the U.S.: US$31.86 billion (–12% YoY), accounting for 21.1% of total exports.
• Exports to non-U.S. markets: US$119.36 billion (–2.9% YoY).
• Exports to the E.U.: US$28.59 billion (+3.1% YoY), share: 18.9%.
• Exports to Japan: US$11.72 billion (+1.0% YoY), share: 7.7%.
• Exports to South Korea: US$6.21 billion (–9.2% YoY).
• Exports to the UK: US$5.39 billion (+3.4% YoY).
• Exports to Australia: US$4.61 billion (–2.0% YoY).
• Exports to Canada: US$2.73 billion (+0.2% YoY).
Exports to Belt and Road Countries
• Total to BRI countries: US$65.1 billion (–5.5% YoY).
• To ASEAN: US$12.32 billion (–19.6% YoY).
• To Latin America: US$9.99 billion (+4.6% YoY).
• To Africa: US$8.51 billion (+15.0% YoY).
• To Central Asia (five countries): US$9.71 billion (–21.2% YoY).
• To GCC countries: US$4.54 billion (–1.7% YoY).
• To Russia: US$3.97 billion (+4.1% YoY).
Zhejiang Province and Shandong Province Saw Export Growth Amid Overall Decline
• Zhejiang Province: US$38.08 billion (+3.8% YoY), accounting for 25.2% of the national total.
• Shandong Province: US$18.51 billion (+0.9% YoY).
• Guangdong Province: US$19.97 billion (–11.5% YoY).
• Jiangsu Province: US$19.43 billion (–7.0% YoY).
• The Xinjiang Uygur Autonomous Region: US$12.0 billion (–8.7% YoY).
• Fujian Province: US$11.32 billion (–15.9% YoY).
Among other municipalities and provinces, Sichuan and Hunan Provinces saw sharp year-on-year declines of 44.7% and 35.7%, respectively. Heilongjiang Province surged by 80.8%; Tianjin and Chongqing grew by 16.2% and 10.6% year-on-year, respectively.
China’s Market Share Shifts: Loss in U.S., Gain in E.U.
• U.S. market (Jan.–Oct.): Vietnam held 19.8% share (+2.3 ppt YoY), becoming the largest supplier; China’s share fell to 15.2% (–7.4 ppt YoY).
• EU market (Jan.–Nov.): China’s share rose to 29.8% (+0.9 ppt YoY); Bangladesh ranked second at 20.9% (+3.3 ppt).
• Japan market (Jan.–Nov.): China’s share declined to 46.9% (–1.7 ppt YoY); Vietnam ranked second at 18.7% (+1.0 ppt YoY).
II. Import Performance
Imports from Neighboring Asian Countries Grew Rapidly
From January to December in 2025, China’s cumulative apparel imports totaled US$10.2 billion, down 2.3% year-on-year. China’s primary sources for imported apparel are Europe and Asia. Imports from Europe have declined significantly, with imports from Italy, France, and Portugal falling sharply by 10.5%, 17.7%, and 13.1% year-on-year, respectively. Imports from neighboring Asian regions have grown more rapidly, with increases of 5.5%, 23.2%, 12.1%, and 3.3% from Vietnam, Bangladesh, Cambodia, and Indonesia, respectively.
Major Apparel Categories See Broad Declines in Imports
From January to December of 2025, China imported US$3.57 billion worth of knitwear, down 3.1% year-on-year; US$5.39 billion worth of woven garments, down 1.4%; and $780 million worth of clothing accessories, down 6.5%.
Guangdong Saw Import Growth Against the Trend
Shanghai remains China’s largest apparel import hub. From January to December, Shanghai imported apparel worth US$7.12 billion, down 3.1% year-on-year, accounting for 69.7% of China’s total apparel imports. Guangdong bucked the trend with imports growing 2.7% year-on-year to $1.09 billion, representing 10.7% of China’s total apparel imports. Major importing provinces and municipalities, including Jiangsu, Zhejiang, and Hainan, saw declines of 11.8%, 2.4%, and 0.1%, respectively.
III. Global Market Overview
Strong Import Growth in E.U. and Japan
In 2025, demand in advanced economies remained stable:
• U.S. apparel imports (Jan.–Oct.): US$74.5 billion (–1.1% YoY).
• E.U. (Jan.–Nov.): US$96.79 billion (+7.6% YoY).
• Japan: US$23.63 billion (+5.5% YoY).
• UK: US$20.41 billion (+8.3% YoY).
• South Korea: US$11.66 billion (–1.9% YoY).
• Australia: US$7.76 billion (–0.5% YoY).
Vietnam and Cambodia Led Export Growth
From January to October of 2025, Vietnam exported garments worth US$30.18 billion, marking an 8.1% year-on-year increase. From January to November, India exported US$15.53 billion worth of garments, a 3.9% increase year-on-year; Turkey exported US$15.44 billion, a 6.3% decrease year-on-year; Cambodia exported US$10.53 billion, a 17.2% increase year-on-year; Indonesia exported US$8.35 billion, up 5.2% year-on-year; and Sri Lanka exported US$4.77 billion, seeing a 4.5% increase year-on-year.
Notably, India and the E.U. recently concluded Free Trade Agreement (FTA) negotiations, set to take effect in early 2027. E.U. imports from India grew by 11.9% year-on-year (Jan.–Nov., 2025). Once implemented, the FTA will grant deeper tariff reductions for Indian goods, potentially pressuring Chinese exporters.
IV. Outlook and Trends
2025 brought significant headwinds: slowing global growth, rising protectionism, and trade fragmentation. Key challenges facing China’s apparel foreign trade are outlined as follows.
First, the United States imposed multiple rounds of tariff hikes, leading to heightened volatility in China’s apparel exports to the U.S., which declined by 12% year-on-year for the full year, with the fourth quarter plummeting by 18.2%. Vietnam’s share in the U.S. market surpassed that of China for the first time, making it the largest apparel supplier to the United States.
Second, the cross-border e-commerce channel, which had experienced rapid growth in recent years, came under pressure. The United States, the European Union, Japan, Vietnam, Mexico, Thailand, and others successively eliminated de minimis trade exemptions and strengthened supervision of small-value shipments, resulting in significant obstacles to cross-border e-commerce exports. On January 21, 2026, Turkey conducted a surprise inspection of cross-border e-commerce platform Temu and announced the cancellation of its previous duty-free policy for packages valued under 30 euros, with the new regulations taking effect in early February 2026.
Third, the relocation of traditional apparel orders accelerated. Influenced by U.S. tariffs and geopolitical factors such as “de-sinicization”, long-term and large-volume orders with relatively simple manufacturing processes have been shifting overseas at a faster pace. Following Southeast Asia, Africa emerged as a new hotspot for investment in the apparel industry in 2025.
Fourth, fluctuations in the RMB exchange rate intensified operational pressures on enterprises. In 2025, the RMB-to-USD exchange rate exhibited a “weak first, strong later” trend, with both offshore and onshore rates breaking through the “7” threshold by year-end, leading to reduced foreign exchange settlement revenues and squeezed profit margins for enterprises.
Faced with multiple challenges, China’s apparel foreign trade industry has demonstrated strong resilience and actively responded under pressure.
First, major eastern provinces such as Zhejiang and Shandong, with their solid industrial chain foundations, achieved export growth against the trend. Second, market diversification has yielded results, with exports to the E.U., Africa, and Latin America maintaining steady growth. Third, China-U.S. economic and trade relations have seen a period of easing, with the two heads of state holding multiple phone calls in 2025 and meeting in Busan, South Korea, and reaching a series of important agreements. The reduction of tariffs on exports to the U.S. has benefited exporting enterprises.
Looking ahead to 2026, uncertainties in the external environment remain prominent, and stabilizing foreign trade still faces considerable pressure. The UNCTAD report points out that factors such as slowing global economic growth, geopolitical fragmentation, policy uncertainty, and rising trade costs are superimposed, and it is expected that global trade growth will become even more sluggish; the WTO has also sharply lowered its 2026 global goods trade growth forecast to 0.5%.
Despite this, China’s economy boasts a solid foundation, a comprehensive industrial system, and strong resilience in development. The apparel industry’s industrial chain advantages continue to consolidate, trade partners are becoming increasingly diverse, and risk-resistance capabilities have significantly improved, keeping foreign trade fundamentals stable. In particular, the Fourth Plenary Session of the 20th CPC Central Committee made important arrangements for promoting innovative trade development, providing stable expectations for the sustained improvement of China’s apparel foreign trade industry and injecting more certainty and positive energy into global economic and trade development.
In the future, China’s apparel industry will rely on its complete industrial system, efficiently coordinated supply chain, and leading innovation capabilities to continue maintaining long-term competitiveness in the international market. Faced with new situations and challenges, apparel enterprises will continue to optimize product portfolio, innovate trade models, and expand into diverse markets, actively integrating into the global industrial chain and supply chain system, thereby continuously enhancing the industry’s risk resistance capabilities and development resilience, promoting the industry to move toward the high end of the global value chain, and achieving higher-quality, and sustainable development.
Source: CHINA TEXTILE LEADER Express


Authority in Charge: China National Textile and Apparel Council (CNTAC)
Sponsor: China Textile Information Center (CTIC)
ISSN 1003-3025 CN11-1714/TS

© 2026 China Textile Leader, all rights reserved.
Powered by SeekRay