
2026/9/22
In the first half of 2026, global geopolitical conflicts continued to intensify, international trade barriers increased, and the U.S.-Iran conflict drove up energy, raw-material and international logistics costs sharply. A phased appreciation of the RMB further compressed export profit margins. The combination of multiple adverse factors put industry profitability under pressure and caused temporary weakening in quality-and-efficiency indicators. Faced with a complex and severe external environment, China’s knitting industry proactively adjusted business strategies, accelerated technological and product innovation, promoted corporate cost reduction and efficiency improvement, tapped domestic consumption potential, and continuously optimized global market deployment, effectively offsetting various operating risks. Industry operations showed a clear recovery trend. In the first half, total knitted-product exports reached a four-year high for the same period, while rapid expansion in emerging markets such as Russia, Africa and South America formed a core source of incremental growth. Domestic consumption demonstrated strong resilience in essential demand, apparel output shifted from decline to growth, the decline in industry revenue continued to narrow, and regional and product structures were optimized in parallel. The industry fully demonstrated the resilience of its industrial chain, laying a solid foundation for high-quality development during the 15th Five-Year Plan period.
1. Revenue Decline Continues to Narrow, While Apparel Output Emerges from a Downward Trend
Benefiting from concentrated Spring Festival consumption and the continued implementation of national policies to promote consumption, China’s terminal demand for textiles and apparel gained sufficient recovery momentum. At the same time, knitted-product exports maintained year-on-year growth. The combined strength of domestic and overseas markets continued to drive recovery in industry revenue and further consolidated the coordinated dual-circulation pattern linking domestic and international markets.
According to the National Bureau of Statistics, in the first half of 2026, operating revenue of enterprises above designated size in the knitting industry fell 1.68% year on year, with the decline narrowing by 0.89 percentage points from the first quarter. By category, operating revenue of knitted-fabric enterprises above designated size fell 0.8% year on year, with the decline narrowing by 0.53 percentage points from the first quarter; operating revenue of knitted-apparel enterprises above designated size fell 2.15% year on year, with the decline narrowing by 1.05 percentage points from the first quarter. By detailed segment, enterprises producing greige knitted fabrics and sportswear performed relatively well, with operating revenue increasing by 1.61% and 0.13% year on year, respectively. Other parts of the industrial chain came under significant pressure.
In terms of apparel output, in the first half of 2026, apparel output of China’s textile and apparel enterprises above designated size shifted from decline to growth, rising 1.81% year on year, 1.41 percentage points higher than in the same period last year. Knitted-apparel output increased by 1.69% year on year, with the growth rate 0.37 percentage points lower than that of woven apparel. Since May, the growth rate of woven-apparel output has exceeded that of knitted apparel for the first time. In the first half of 2026, knitted apparel accounted for 68.77% of total apparel output, down 0.48 percentage points from the same period last year.
2. Industry Profits Come Under Deep Pressure, While Operating Quality and Efficiency Improve at the Margin
In the first half of 2026, the overall operating quality and efficiency of China’s knitting industry came under pressure. However, in the second quarter, lower raw-material prices following an easing of the geopolitical situation, continued recovery in domestic sales, concentrated release of seasonal orders, and internal corporate cost reduction and efficiency improvement combined to produce a clear marginal recovery in quality and efficiency. Profitability recovered, the share of loss-making enterprises narrowed, and industry operations showed temporary signs of improvement.
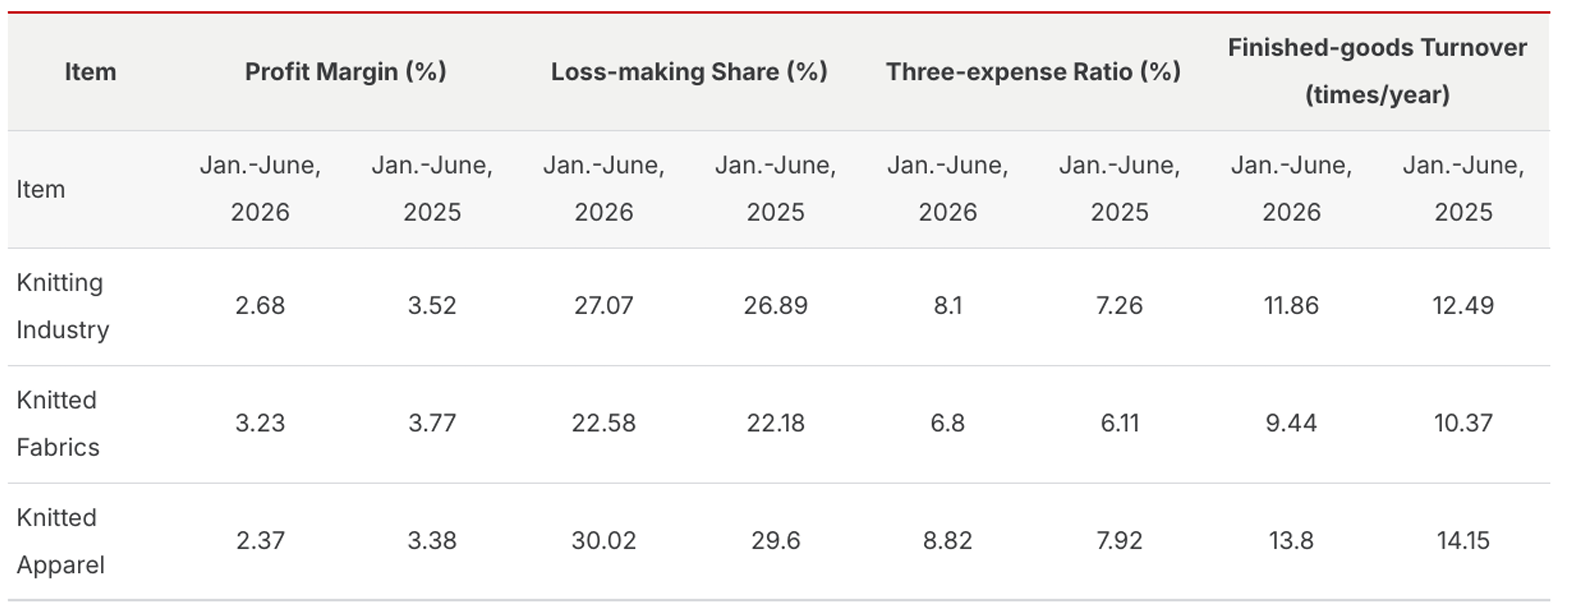
According to the National Bureau of Statistics, from January to June 2026, total profits of enterprises above designated size in the knitting industry fell 20.08% year on year, 9.08 percentage points lower than in the same period last year; the operating profit margin was 2.68%, down 0.84 percentage points year on year; the loss-making share was 27.07%, up slightly by 0.18 percentage points; the ratio of the three expenses was 8.10%, up 0.84 percentage points; and finished-goods turnover was 11.86 times/year, down 0.63 times/year (Table 1). Compared with the first quarter, recovery characteristics were clear in the second quarter: the industry profit margin rose by 0.73 percentage points, with single-quarter profitability improving significantly; the loss-making share narrowed sharply by 5.67 percentage points; and enterprise expense control delivered results, with the ratio of the three expenses declining slightly. Only finished-goods turnover edged down, indicating a slower pace of inventory reduction.
By product category, knitted apparel was dragged down by terminal demand and faced poor price transmission, resulting in a larger decline in operating profits and a weaker recovery in quality and efficiency than knitted fabrics. According to the National Bureau of Statistics, from January to June 2026, total profits of knitted-apparel and knitted-fabric enterprises above designated size fell by 27.86% and 6.61% year on year, respectively, while their profit margins were 2.37% and 3.23%, respectively (Table 1). Profitability stability in upstream fabrics was better than in terminal garments, but overall profitability remained at a low level for the industry and still needs further improvement.
Table 1 Key Performance Indicators of Enterprises Above Designated Size in China’s Knitting Industry, Jan.–Jun. 2026
Source: National Bureau of Statistics
3. Export Scale Reaches a New Stage High, Highlighting Industry Resilience amid External Shocks
In the first half of 2026, influenced by overseas stocking for the second half of the year, improved China-U.S. economic and trade relations, front-loaded shipments ahead of U.S. tariffs, and the return of some orders to China as Southeast Asian supply chains were hit by energy and international-logistics disruptions caused by the U.S.-Iran conflict, China’s knitted-product export value reached a four-year high for the same period and maintained a growth trend. Against a backdrop of weak global market demand, escalating geopolitical conflicts and sharp changes in tariff policies in major markets, the industry demonstrated strong resilience under pressure.
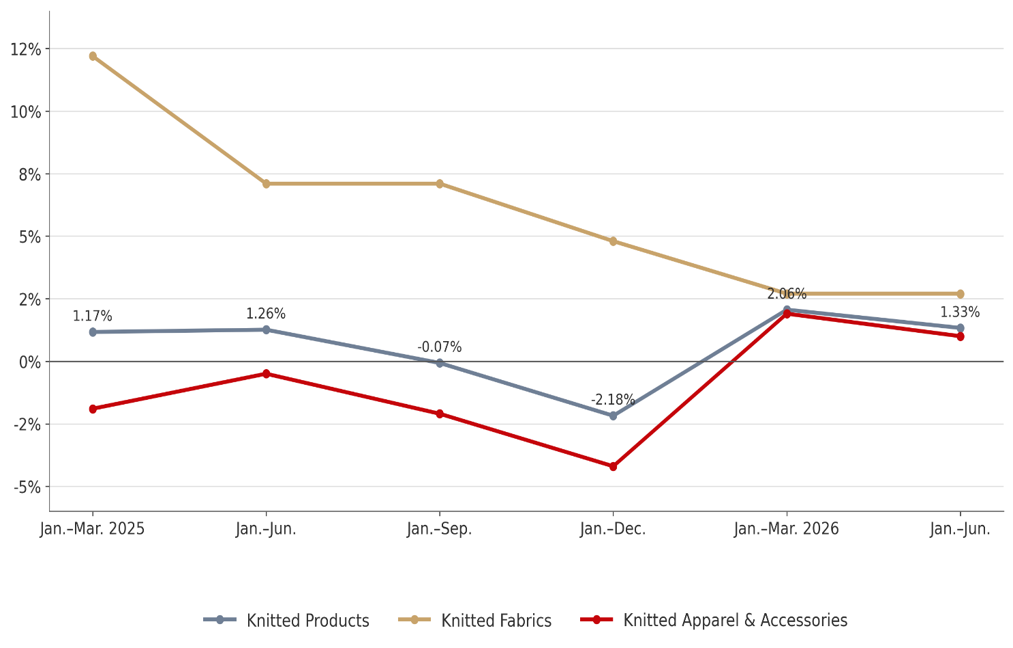
According to China Customs statistics, from January to June 2026, China’s exports of knitted products totaled US$51.52 billion, up 1.33% year on year, 0.08 percentage points higher than in the same period last year. Of this, knitted-fabric exports reached US$12.68 billion, up 2.7% year on year; exports of knitted apparel and accessories reached US$38.83 billion, up 0.89% year on year, 0.94 percentage points higher than in the same period last year (Figure 3). Among these, chemical-fiber knitted apparel increased by 2.4% year on year, while cotton knitted apparel declined by 1.5%, showing a clear trend toward optimization of the product structure.
Figure 3 Export Growth of Knitted Products, Knitted Fabrics and Knitted Apparel & Accessories, 2025–Jun. 2026
Source: China Customs
From the monthly export perspective, first-quarter exports fluctuated considerably year on year due to the Spring Festival holiday, but total exports remained generally stable, increasing by 2.06% year on year. Since the second quarter, exports have shown a low-then-high pattern. Dragged down by the EU market, exports declined continuously in April and May, before turning from negative to positive in June, rising 5.4% year on year and 18.87% month on month. Knitted fabrics increased by 12.6% year on year and 8.54% month on month, while knitted apparel increased by 3.45% year on year and 22.29% month on month. The sharp increase in June exports mainly benefited from concentrated shipments before new U.S. tariffs took effect. At the same time, because U.S. tariffs depressed China’s exports to the United States in April-May of the previous year, the base was low and this year’s exports to the United States recorded high year-on-year growth. Fundamental global market demand has not changed.
3.1 Tariff and Trade Policies Disrupt Traditional Markets, Causing Sharp Fluctuations
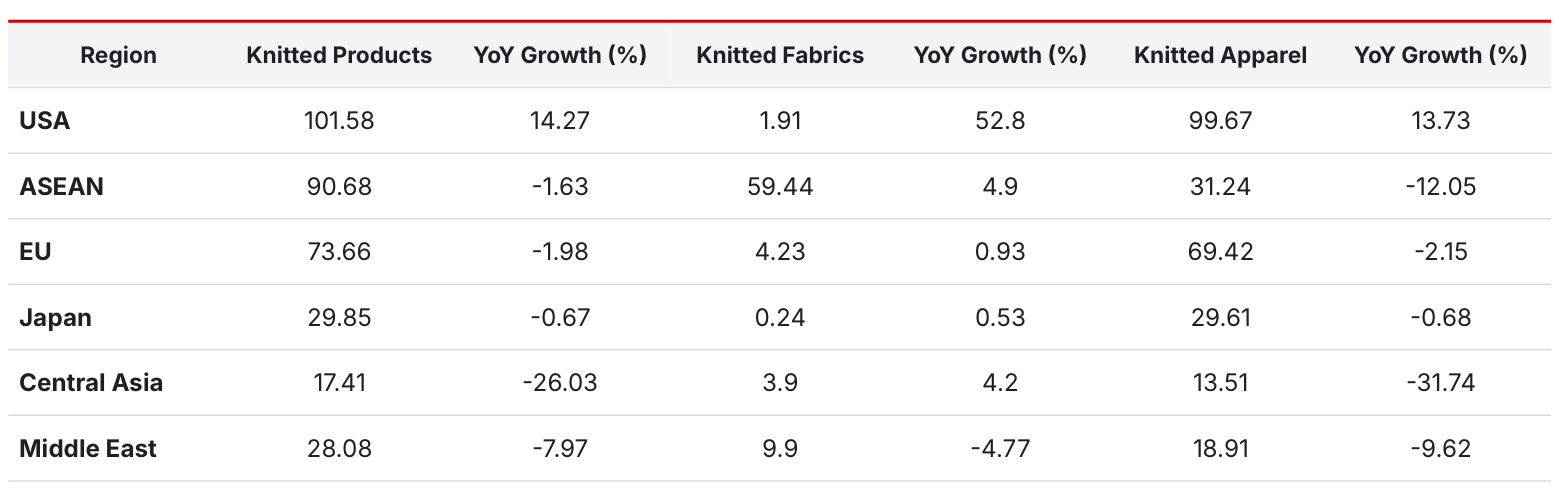
From January to June 2026, China’s exports of knitted products to the United States totaled US$10.16 billion, up 14.27% year on year, directly contributing 5.8 percentage points to China’s knitted-product export growth. This reversed the continuous decline and brought the growth rate to a high level in recent years. The main driver was U.S. tariff policy, with the low base in the same period last year compounded by rush shipments before new tariff rules took effect.
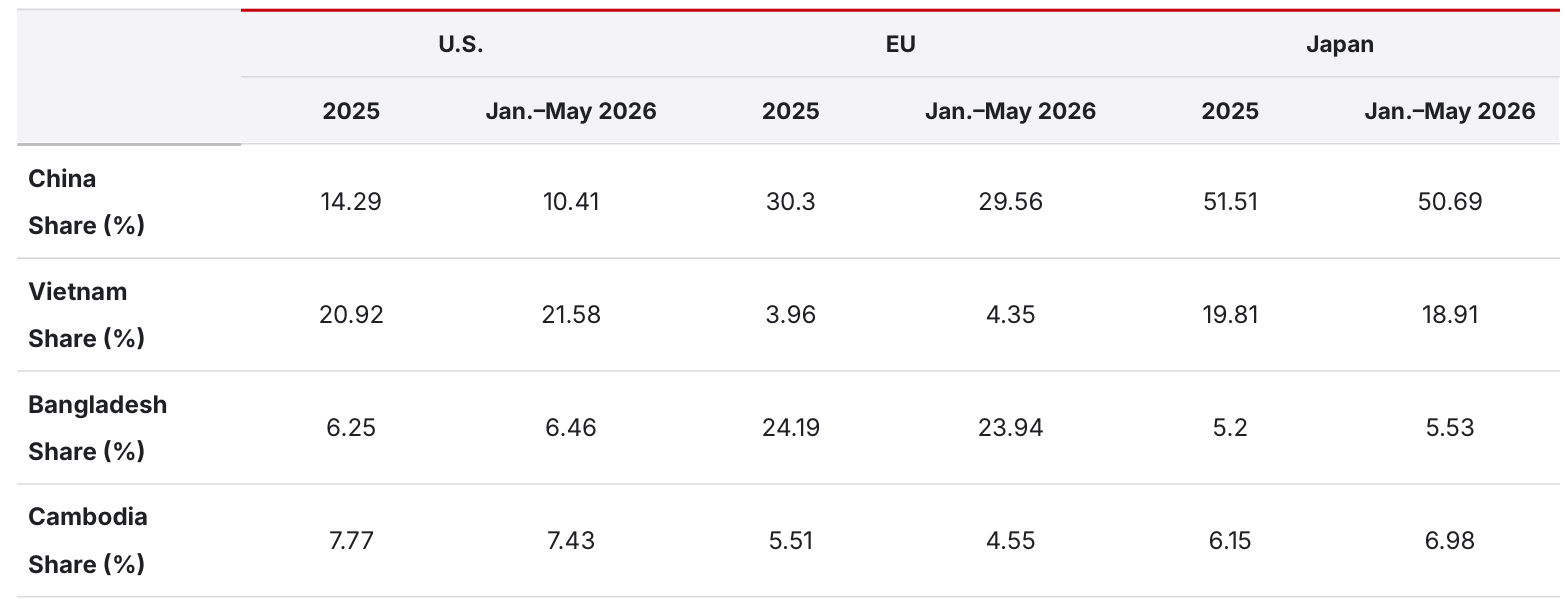
According to data from the U.S. Department of Commerce, from January to May 2026, China’s share of the U.S. import market for knitted products continued to decline, falling from 14.29% in 2025 to 10.41%, but rising by 0.08 percentage points from the first quarter. Vietnam, Bangladesh and Cambodia were affected by energy and logistics disruptions, causing some orders to return to China. Their respective shares of the U.S. market were 21.58%, 6.46% and 7.43%, all lower than in the first quarter.
Exports to the EU totaled US$7.37 billion, down 1.98% year on year. Exports to the EU increased by 6.74% year on year in the first quarter. Since the China-U.S. tariff war, China’s knitted-product exports to the EU have shown continuous growth and have been a major contributor to export growth. Affected by the U.S.-Iran conflict, high energy costs in the EU market pushed inflation higher and weakened consumer demand, while EU trade policies also changed. In April and May, exports to the EU fell by 10.04% and 13.91% year on year, respectively, becoming the main factor dragging down first-half exports.
According to Eurostat data, from January to May 2026, affected by year-on-year declines of 10.04% and 13.91% in China’s exports to the EU in April and May, respectively, the share of China’s knitted products in EU import trade declined from 30.3% in 2025 to 29.56%, while Bangladesh’s market share stood at 23.94% over the same period.
Exports to Japan totaled US$2.99 billion, down 0.67% year on year. After a short-lived rebound in 2025, exports to Japan returned to a downward trend. According to Japan Customs data, from January to May 2026, China’s share of Japan’s knitted-product imports edged down from 51.51% in 2025 to 50.69%, although it rose slightly compared with the first quarter. With China-Japan relations tense, the Japanese market is expected to continue declining.
Exports to the 10 ASEAN countries totaled US$9.07 billion, down 1.63% year on year, with the decline narrowing by 1.69 percentage points from the first quarter. Of this, knitted-fabric exports reached US$5.94 billion, up 4.9% year on year, with the growth rate widening by 3.26 percentage points from the first quarter. A brief ceasefire in the U.S.-Iran conflict in June allowed ASEAN supply chains to recover rapidly, driving China’s knitted-product exports to ASEAN up 5.96% year on year. In recent years, Chinese enterprises have accelerated their relocation to Southeast Asia and newly built capacity has gradually come on stream, reducing dependence on China. At the same time, the easing of U.S. tariff policy and RMB appreciation have reduced re-export trade in finished products (Tables 2 and 3).
Table 2 Exports of China’s Knitted Products to Major Regions, Jan.–Jun. 2026 (US$100 million)
Source: China Customs
Table 3 Shares of China’s Knitted Products in Import Trade of the U.S., EU and Japan
Source: U.S. Department of Commerce, Eurostat, Japan Customs
From the perspective of monthly exports, affected by the timing difference of the Spring Festival, the U.S.-Iran conflict, tariff and trade policies and other factors, knitted-product exports showed wide fluctuations.
3.2 Emerging Markets Become the Core Source of Incremental Growth, Highlighting the Effectiveness of Diversification
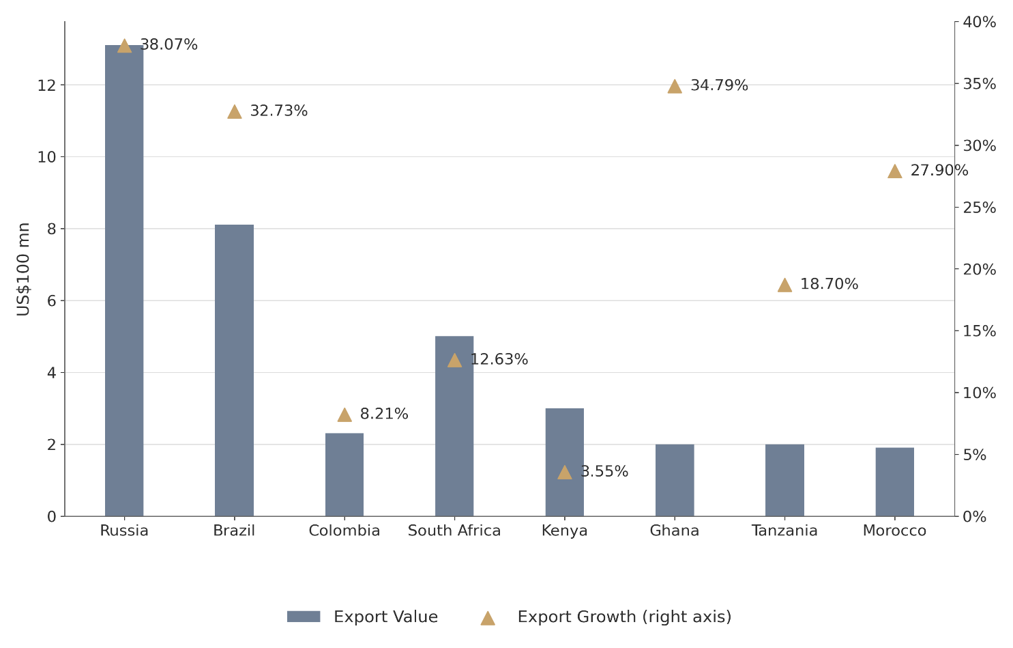
In recent years, the international situation has changed dramatically, while China-Russia relations have continued to consolidate and bilateral economic and trade cooperation has maintained high-quality development. Geopolitical sanctions have prompted Western brands to withdraw one after another, creating supply gaps, and China has become a key force in filling the Russian market. From January to June 2026, China’s knitted-product exports to Russia totaled US$1.32 billion, up 38.07% year on year, making Russia one of the fastest-growing destinations for China’s knitted-product exports in the first half and lifting it to China’s sixth-largest trading country for knitted products. At the May 2026 meeting between the Chinese and Russian heads of state, the two sides proposed improving the quality and upgrading trade in goods and services, deepening interconnection and interoperability of the ‘Single Window’, and facilitating bilateral trade. This will further promote rapid growth of China’s knitted products in the Russian market.
Amid deepening China-Africa economic and trade ties and continued efforts by Chinese exporters to diversify overseas markets, China’s knitted-product exports to Africa grew rapidly. From January to June 2026, China’s knitted-product exports to Africa totaled US$3.8 billion, up 11.16% year on year. Exports were mainly concentrated in South Africa, Kenya, Tanzania, Ghana and Morocco, with export values of US$511 million, US$297 million, US$198 million, US$193 million and US$190 million, respectively, up 12.63%, 3.55%, 18.7%, 34.79% and 37.9% year on year. The five countries together accounted for 36.6% of China’s knitted-product exports to Africa. China’s zero-tariff treatment for imports from all 53 African countries with diplomatic ties, effective from May 1, is expected to further deepen bilateral trade and economic ties. During the same period, the South American market also showed steady growth. From January to June, China’s knitted-product exports to South America totaled US$2.49 billion, up 9.18% year on year. Exports to Brazil and Colombia reached US$814 million and US$241 million, respectively, increasing by 32.73% and 8.21% compared with the same period last year (Figure 4). The effectiveness of Chinese enterprises’ market-diversification strategy has become evident, with the potential of emerging markets gradually being released and effectively offsetting demand volatility caused by geopolitical risks in traditional markets.
Figure 4 Exports of China’s Knitted Products to Emerging Markets, Jan.–Jun., 2026
Source: China Customs
3.3 Concentration in Eastern Coastal Regions Increases, While Inland Relocation Becomes a New Growth Point
Traditional eastern coastal powerhouses including Zhejiang, Jiangsu, Guangdong, Shandong and Fujian have shown significantly stronger resistance to external risks than other provinces and municipalities, thanks to first-mover advantages in industrial clusters, supply-chain support, R&D and innovation, and market diversification. From January to June 2026, knitted-product exports from these five eastern provinces totaled US$40.5 billion, accounting for 78.61% of the national total, 1.11 percentage points higher than in the same period last year. Their exports increased by 2.78% year on year, 1.45 percentage points above the industry’s overall export growth. Zhejiang and Guangdong performed particularly well, with export growth rates of 6.54% and 6.39%, respectively, 5.21 and 5.06 percentage points above the industry growth rate. Shandong, which has relatively high dependence on trade with Japan, saw export value decline by 5.68% year on year amid tense China-Japan relations. During the same period, some central provinces and cities as well as the Northeast recorded export growth, further optimizing the industry’s regional structure. Exports from Henan, Anhui, Jiangxi, Heilongjiang, Jilin and Liaoning increased by 17.78%, 12.83%, 4.91%, 58%, 32.81% and 6.78% year on year, respectively. Xinjiang and Guangxi, affected respectively by the continued tightening of Europe-U.S. trade scrutiny related to Xinjiang, a sharp decline in exports to Central Asia, and volatility in exports to Southeast Asia, recorded year-on-year declines of 14.95% and 12.11%.
3.4 Export Product Structure Improves, While the Competitiveness of Functional Sports Products Strengthens
From January to June 2026, exports of all major categories increased year on year except underwear and homewear, gloves and warp-knitted fabrics. Pile fabrics, sportswear, shirts, children’s wear and T-shirts performed well, with export growth rates of 3.98%, 4.38%, 3.64%, 2.98% and 1.86%, respectively, all higher than the industry growth rate. Driven by the World Cup, sportswear exports shifted from decline to growth, with the growth rate 15.5 percentage points higher than in the same period last year. Exports of knitted shirts reached 251 million pieces, and their export value accounted for 32.82% of total shirt exports, up 1 percentage point year on year, continuing an upward trend. Gloves were hit by the combined impact of rising upstream chemical raw-material prices and intensifying market competition, with export value and export unit price falling by 3.78% and 6.85%, respectively. In terms of price and volume, major categories continued to show a pattern of rising volume and falling prices, except for warp-knitted fabrics, sportswear and shirts, where prices stopped declining and recovered.
4. Outlook for the Second Half of the Year
Entering the second half of the year, the effects of earlier phased measures to stimulate domestic consumption are gradually fading, and the marginal slowdown in domestic-demand growth seen in the second quarter may continue. In July, the national manufacturing PMI fell to 49.2%, while the PMI for the consumer goods sector dropped to 47.8%, down 2.4 percentage points from the previous month. This suggests that, without a more sustained improvement in household income and consumer confidence, the near-term recovery in domestic consumption may continue to face pressure.
Over the longer term, however, policy support continues to strengthen. The special action to boost consumption set out in the 2026 Government Work Report and medium- and long-term consumption-promotion measures under the 15th Five-Year Plan are being implemented in coordination. Measures to cultivate domestic brands, expand scenario-based consumption and promote trade-in programs for textiles and apparel are also continuing to take effect. These policies are expected to help strengthen endogenous household-consumption momentum. Overall domestic demand for knitted products is therefore expected to maintain a moderate recovery, while structural growth opportunities remain in segmented markets.
The global economic and trade environment remains complex and volatile, with uncertainty continuing to rise. External-demand support for China’s knitted-product exports has weakened, while multiple adverse factors continue to constrain the industry’s export potential. The renewed U.S.-Iran conflict has contributed to sharp fluctuations in crude oil, chemical-fiber feedstock and logistics costs. On the exchange-rate side, the RMB has maintained a phased appreciation trend, continuing to put pressure on export earnings after currency conversion.
Global growth momentum has weakened, while world trade growth is also expected to slow. In its July World Economic Outlook Update, the International Monetary Fund projected global economic growth at 3.0% in 2026. World trade volume growth is projected to slow sharply from 5.0% in 2025 to 3.5% in 2026. Europe and Japan continue to face relatively weak consumer demand, while U.S. demand has shown greater near-term resilience but remains exposed to tariff, inflation and policy uncertainty.
Trade-policy barriers also continue to increase. Under the latest U.S. Section 301 action concerning forced-labor import prohibitions, covered Chinese goods are generally subject to an additional 12.5% duty, subject to specified product exemptions. Separately, under U.S. measures targeting tariff evasion, goods determined by U.S. Customs and Border Protection to have been transshipped to evade applicable duties may face an additional 40% tariff, alongside other possible penalties. These increasingly differentiated U.S. tariff measures may accelerate the regionalization and fragmentation of global apparel supply chains, while overseas production strategies traditionally used by Chinese enterprises to diversify supply chains and mitigate tariff exposure may also face new risks and challenges.
EU sustainability, circular-economy and e-commerce requirements for textiles are also tightening. Since July 1, 2026, the EU has abolished the €150 customs-duty exemption for low-value imported consignments and introduced a temporary €3 customs duty per item in qualifying low-value consignments. Since July 19, 2026, large companies have been prohibited from destroying unsold apparel, clothing accessories and footwear, subject to specified exemptions. EU Member States are also moving toward the implementation of mandatory Extended Producer Responsibility (EPR) schemes for textiles and footwear. Digital Product Passport (DPP) requirements for textile and apparel products remain under development, with the relevant ESPR delegated act currently planned for the fourth quarter of 2027. In addition, the EU’s Empowering Consumers for the Green Transition (EmpCo) Directive, which strengthens rules against misleading environmental claims, will apply from September 27, 2026. Together, these measures are increasing compliance and market-access costs for textile exporters.
At the same time, structural opportunities remain. Supported by a comprehensive domestic supply chain, relatively stable energy supply and a large domestic market, China’s knitting industry continues to demonstrate considerable resilience compared with some Southeast Asian competitors facing energy shortages and supply-chain constraints. Knitted-product exports are therefore expected to remain broadly resilient in the second half of the year, while emerging markets along the Belt and Road are likely to remain an important source of incremental growth, helping offset downward pressure in developed markets.
Source: CHINA TEXTILE LEADER Express


Authority in Charge: China National Textile and Apparel Council (CNTAC)
Sponsor: China Textile Information Center (CTIC)
ISSN 1003-3025 CN11-1714/TS

© 2026 China Textile Leader, all rights reserved.
Powered by SeekRay