2025/7/24
In May, China’s textile and apparel exports faced a challenging external environment. The reciprocal tariffs imposed by the United States affected exports, leading to nearly a 20% year-on-year decline in exports to the U.S. This caused the cumulative increase in China’s textile and apparel exports to the U.S. from January to May to turn from positive to negative. Exporters accelerated their adjustments to export strategies and redirected orders to other regions. Exports to the European Union surged by 19.6% year-on-year, and exports to Japan, South Korea, Saudi Arabia, Nigeria, and other markets also experienced varying levels of growth.
I. Foreign Trade of China’s Textile and Apparel
From the perspective of export destinations, in May, influenced by the U.S. government’s reciprocal tariff policy, China’s textiles and apparel exports to the United States decreased by 19.6%; exports to ASEAN declined by 4.4%; exports to the European Union increased by 19.4%, marking the third consecutive month of growth exceeding 15%. Meanwhile, exports to Japan shifted from a year-on-year decline to a 5.6% increase.
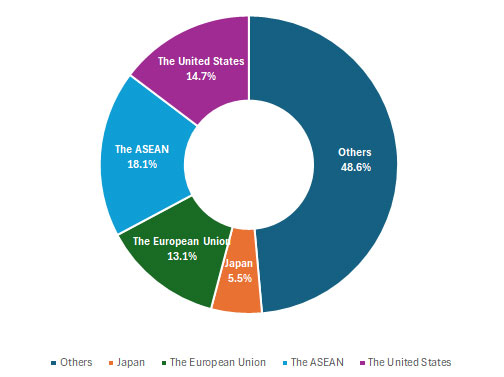
From January to May, China’s textile and apparel exports to the European Union and Japan increased by 9.8% and 1.9%, respectively, while exports to the United States and ASEAN fell by 4.2% and 5.7% respectively. In the first five months, China’s exports to the above four traditional markets totaled US$59.98 billion, accounting for 51.4% of China’s total exports. Exports to the “Belt and Road” countries amounted to US$67.54 billion, up 0.3% year-on-year, accounting for 57.9% of total exports.
Figure 1: China’s Textile and Apparel Exports by Market Share in Jan.-May 2025
(A) China’s exports to the U.S. declined 19.6% in May, and total exports for the first five months shifted from positive to negative
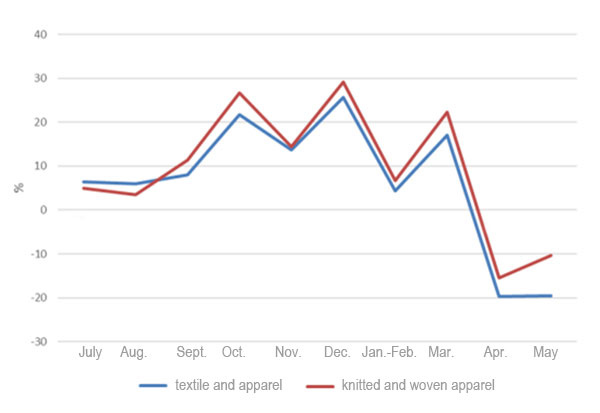
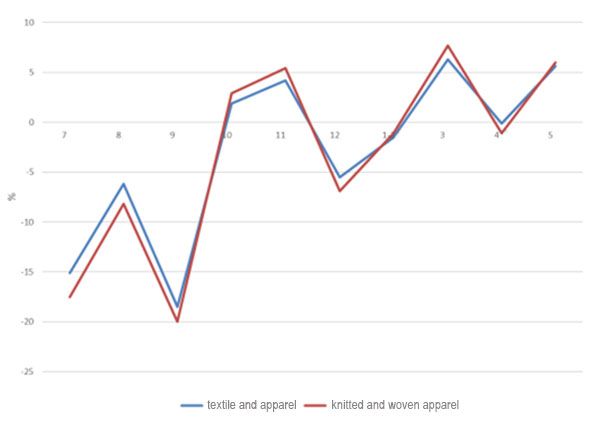
The U.S. imposed reciprocal tariffs on global trading partners, triggering a trade war, while simultaneously increasing taxes on cross-border small packages, which raises the tariff risk for U.S. buyers. After the new tariff policy took effect, the duty rate for exports from China could reach up to 54%. This change has affected e-commerce platforms that rely primarily on direct mail. According to media reports, in May, China’s low-priced small parcel exports to the U.S. dropped 40 percent year-on-year to approximately US$1 billion, hitting the lowest level since early 2023. China exported US$3.5 billion worth of textiles and apparel to the U.S., dropping 19.6% from the previous year. The export value of knitted and woven apparel, the main product shipped to the U.S., totaled US$2.41 billion, declined by 10.3% year-on-year. Export volume fell by 5.3%, and the unit price of exports also declined by 5.3%.
From January to May, China exported US$17.17 billion worth of textiles and apparel to the United States, a 4.2% decrease compared to the previous year, which is 5 percentage points lower than the January-April period, turning into negative growth. Among the main products, exports of knitted and woven apparel reached US$10.78 billion, a 0.6% increase year-on-year, with export volume rising by 7.6%, while the export unit price fell by 6.5%.
According to U.S. import data, in April, the United States imported US$9.61 billion worth of textiles and apparel from around the world, reflecting a 6.5% increase year-over-year. Imports from China declined by 12.3%, while shipments from Vietnam jumped 25.2%. Imports from India grew by 6.5%, and those from Bangladesh increased by 36.8%. China, Vietnam, India, and Bangladesh made up 17.5%, 14.5%, 10.9%, and 8.2% of the United States’ imports, respectively.
Figure 2: Y-o-Y Growth of China’s Textile and Apparel Exports to the U.S., from July 2024 to May 2025
(B) China’s exports to ASEAN fell 4.4% in May, and exports of yarn and fabric declined 5.4%
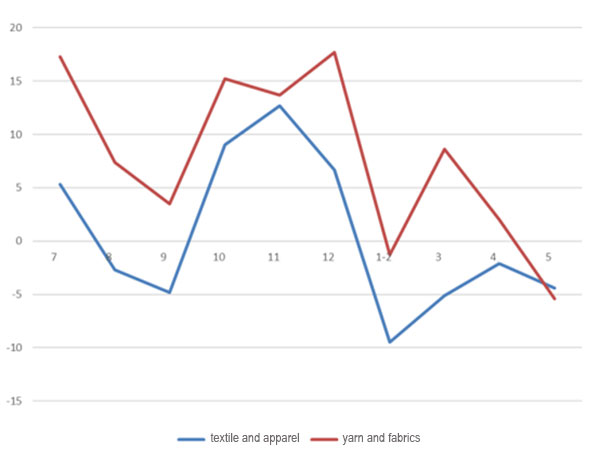
In May, the ASEAN economy was affected by the “U.S. tariffs, weak global demand, and domestic demand, creating triple pressure that caused most countries to slow growth. In the short term, export-driven economies like Vietnam and Thailand experienced a greater impact. During that month, China exported US$4.64 billion worth of textiles and apparel to ASEAN, representing a 4.4% year-on-year decline, which is a 2 percentage point drop from the previous month. Of this, yarn and fabric exports reached US$2.53 billion, down by 5.4% year-on-year. From January to May, China’s total exports of textiles and apparel to ASEAN reached US$21.11 billion, representing a 5.7% decrease compared to the same period last year.
Specifically, exports to Vietnam were US$7.32 billion, down 5.8% year-on-year, while exports to Cambodia increased by 15.4% to US$2.88 billion, and exports to Indonesia grew by 7% to US$2.33 billion. Regarding product categories, from January to May, China exported US$11.62 billion worth of yarn and fabrics to ASEAN, marking a slight increase of 0.6% year-on-year. Apparel exports totaled US$5.37 billion, reflecting a decline of 16.1% year-on-year.
Figure 3: Y-o-Y Growth of China’s Textile and Apparel Exports to the ASEAN., from July 2024 to May 2025
(C) China’s exports to the E.U. rose 19.4% in May, and knitted and woven garment exports rose in both volume and price
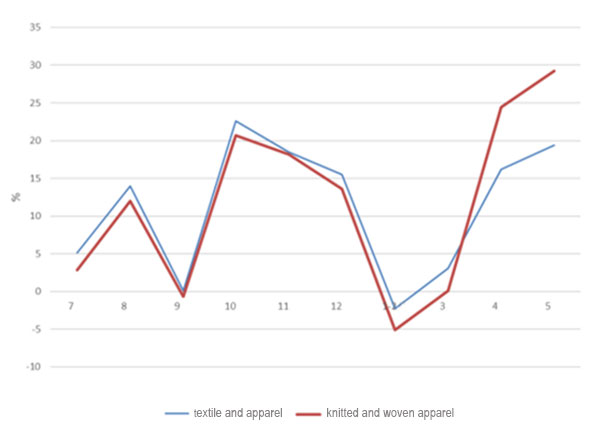
In May, the U.S. and China adjusted their tariff policies, leading to a change in textile and apparel trade. Supported by consistent demand for consumer goods in the European market, strong supply chain resilience in Europe, and improved logistics and trade facilitation, enterprises expanded into the EU market, boosting China’s textile and apparel exports to maintain high growth. China exported US$4.22 billion worth of textiles and apparel to the E.U. that month, a 19.4% increase compared to the previous year. Specifically, exports to Germany, the Netherlands, and France saw more growth, with exports to these three countries amounting to US$740 million, US$530 million, and US$510 million, respectively, surging by 36%, 31%, and 24% respectively.
From a product perspective, in May, China exported US$2.68 billion worth of knitted and woven apparel to the E.U., up by 29.2% year-on-year. Thereinto, the export volume increased by 21.4%, while the export unit price rose by 6.5%. From January to May, China exported US$15.3 billion worth of textiles and apparel to the E.U., representing a 9.8% year-on-year growth. The main products, knitted and woven apparel, contributed US$8.61 billion to export value, up by 12.4%. According to E.U. import data, in April, the E.U. imported textiles and apparel valued at US$10.85 billion, seeing a 5.2% increase. The top three sources of imports were China, Bangladesh, and Turkey, with imports of US$2.77 billion, US$2.13 billion, and US$1.15 billion, respectively, accounting for 26%, 20%, and 11%. From a year-on-year perspective, imports from China and Bangladesh increased by 10.8% and 11.1%, respectively, while imports from Turkey decreased by 7%.
Figure 4: Y-o-Y Growth of China’s Textile and Apparel Exports to the E.U., from July 2024 to May 2025
(D) China’s exports to Japan rose 5.6% in May, and cumulative exports maintained growth in January-May period
In May, China’s bilateral trade with Japan showed a trend of growing exports but falling imports, leading to an even larger trade surplus. On June 29, the General Administration of Customs in China announced the conditional reopening of specific areas for Japanese aquatic product imports. The trade balance with Japan and exports of textiles and apparel remain positive. In May, China exported US$1.16 billion worth of textiles and apparel to Japan, seeing a 5.6% increase. The main export products included knitted and woven clothing, totaling US$710 million, up 6%. From January to May, China’s total exports of textiles and apparel to Japan reached US$6.4 billion, seeing a 1.9% rise from the previous year. Among them, exports of knitted and woven garments totaled US$4.13 billion, up 2.2% year-on-year. According to Japan’s import data, in April, Japan imported US$2.89 billion worth of textiles and apparel, up by 11.5% compared to the previous year. China, Vietnam, and Bangladesh were the top three sources, with import values of US$1.5 billion, US$440 million, and US$140 million, respectively, accounting for 52%, 15%, and 5%. Imports from China, Vietnam, and Bangladesh increased by 8%, 11%, and 27% year-on-year, respectively.
Figure 5: Y-o-Y Growth of China’s Textile and Apparel Exports to Japan, from July 2024 to May 2025
(E) China’s exports to the “Belt and Road” countries experienced slower growth in May
In May, China’s textiles and apparel exports to “Belt and Road” countries reached $15.13 billion, reflecting a 0.3% year-over-year increase, which is four percentage points slower than the previous month. Among these, exports to South Korea grew by 4.6%, exports to Nigeria rose by 33%, exports to Saudi Arabia increased by 11%, exports to Chile went up by 29%, and exports to Pakistan increased by 19%. In the first five months, China exported $67.54 billion worth of textiles and apparel to “Belt and Road” countries, marking a 0.3% rise compared to the same period last year. Specifically, exports to South Korea grew by 3.1%, exports to Brazil increased by 4.5%, exports to Nigeria climbed by 29%, exports to Chile increased by 26%, and exports to Pakistan rose by 34%.
II. In May, the export value of yarn, as well as knitted and woven clothing, increased; the decline in export prices of major commodities does not change
In May, exports of yarn and knitted and woven clothing increased by 3.9% and 3.5% year-over-year, while exports of fabrics and home textiles declined by 1.6% and 2.0%, respectively. Overall, exports of yarn, fabrics, home textiles, and knitted and woven clothing grew by 15.7%, 9%, 5.3%, and 5.9%. The export prices for these four categories continued to fall, with yarn, fabrics, home textiles, and knitted and woven apparel decreasing by 10.2%, 9.7%, 6.9%, and 2.3%, respectively. Export prices for knitted and woven apparel narrowed. From January to May, the total export value of textiles reached US$58.48 billion, up 2.5% year-on-year; clothing exports totaled US$58.2 billion, down 0.5%. For these four categories, exports of yarn, fabrics, and home textiles increased by 7.3%, 3.2%, and 0.8%, respectively, while exports of knitted and woven apparel decreased by 0.8%. All four categories show a trend of rising volumes but falling prices, with export volumes increasing by 12.2%, 11.9%, 12.4%, and 7.4%, and export prices dropping by 4.3%, 7.7%, 10.3%, and 7.6%, respectively. Overall, the prices of manufactured goods declined more than those of intermediate goods, squeezing the profit margins of manufacturing companies.
III. In May, exports from Zhejiang Province, Shandong Province, and Shanghai Municipality performed better than average, while Guangdong Province and Fujian Province experienced a larger decline
In May, among the top seven regions, Zhejiang Province, Shandong Province, and Shanghai Municipality experienced growth rates of 7.3%, 17.8%, and 3.9%, respectively; Jiangsu Province, Guangdong Province, Fujian Province, and Xinjiang Uygur Autonomous Region declined by 2.5%, 11.9%, 5.9%, and 5.7%. For the first five months, Zhejiang Province, Jiangsu Province, Shandong Province, and Shanghai Municipality, among the top seven key regions, saw textile and apparel exports increase by 7.5%, 4.1%, 10.1%, and 6.7%, while Guangdong Province, Fujian Province, and Xinjiang Uygur Autonomous Region experienced declines of 9.6%, 18.6%, and 8.6%. Nineteen of China’s 31 provinces, municipalities, and regions (excluding Hong Kong, Macao, and Taiwan) achieved export growth, with Hubei up 12.2%, Hebei up 10.1%, Tianjin up 12.1%, Beijing up 12.9%, Heilongjiang and Chongqing each rising by 29%.
IV. Cotton price trend differentiation, widening internal and external price gap
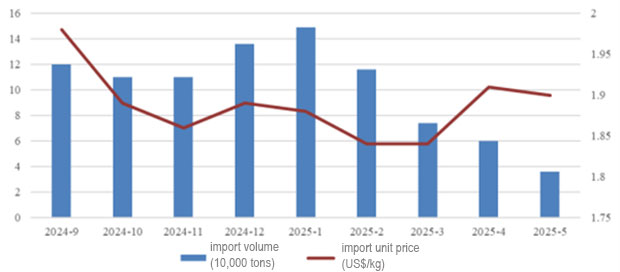
According to the information released by the China Cotton Association, in May, the “Joint Statement on China-U.S. Economic and Trade Meeting in Geneva” achieved key results. Bilateral tariffs have decreased significantly, while the domestic policy of reducing interest rates continues to advance, effectively boosting market consumption. Market confidence has been strengthened. Due to this, despite a month-on-month decline in yarn output caused by seasonal factors, Xinjiang's capacity experienced year-on-year growth. China imported 40,000 tons of cotton in May, seeing a drop of 86.3% year-on-year and 42.2% month-on-month.
Figure 6: Monthly Cotton Import Volume and Price Trends from September 2024 to May 2025
Source: CHINA TEXTILE LEADER Express


Authority in Charge: China National Textile and Apparel Council (CNTAC)
Sponsor: China Textile Information Center (CTIC)
ISSN 1003-3025 CN11-1714/TS

© 2026 China Textile Leader, all rights reserved.
Powered by SeekRay