2024/9/24

Supported by the macro-policy, recovered external demand, and new quality productivity, China’s GDP grew 5.0% year-on-year in the first half of 2024. The chemical fiber industry operation presents a restorative growth trend in this context. Specifically, production saw rapid year-on-year growth based on a low base, and its growth rate gradually fell; the downstream demand performed better than in the same period of last year; economic efficiency increased sharply year-on-year, and the operation quality improved; fixed-asset investment growth rate rebounded, the actual new production capacity slowed down. Affected by trade barriers, geopolitical conflicts and other impacts, chemical fiber exports have declined.
I.Production & Sales
According to the National Bureau of Statistics, the chemical fiber output totaled 38.85 million tons in the first half of 2024, seeing a year-on-year increase of 13.24%, 6.86 percentage points narrower than the first quarter (Figure 1). By month, chemical fiber output remained stable; the change in growth rate is largely due to the base change in the same period last year. It is expected that with the improvement of the base, the growth rate of production may fall further.
Figure 1: The Output of Chemical Fibers from the Beginning of 2023

Source: National Bureau of Statistics, China Chemical Fibers Association (CCFA)
Since the beginning of 2024, the inventory of polyester filament and polyurethane fiber has faced great pressure. The inventory of polyester staples and polyamide fiber was relatively low, but it tended to be higher from June to July. The viscose staple inventory is maintained at a low level.
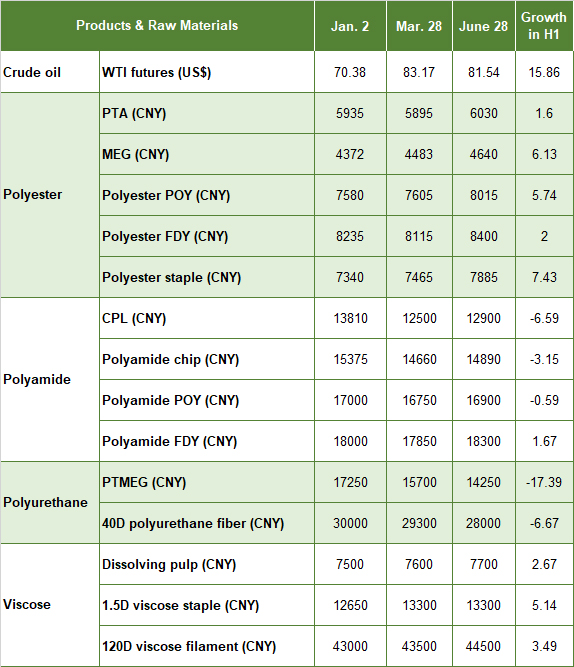
II. Market & Price
Overall, as of the end of June, raw material prices in the polyester and viscose fiber industries showed an upward trend; the polyurethane and polyamide industries showed a downward trend (Table 1).
Table 1: Price Change of Main Chemical Fibers and Raw Materials
III. Foreign Trade
According to China Customs, the total exports of main chemical fibers fell 4.09% year-on-year in the first half, 3.97 percentage points narrower than that of the first quarter. By sub-products, polyester filament exports fell by 7.25% year-on-year, with a reduction of 151,000 tons. This is mainly because of the implementation of India BIS certification of polyester filament in October 2023. Chemical fiber enterprises rushed to export, boosting the export performance; after the implementation, the export volume dropped significantly. China’s polyester filament exports to India were reduced by 238,000 tons in H1; therefore, polyester filament exports to other countries and regions except for India still maintained growth. Thanks to the export growth in the second quarter, polyester staple and polyamide filament exports increased year-on-year; viscose filament, acrylic fibers, and polyurethane fiber exports maintained the growth trend. (Table 2)
Table 2: Foreign Trade of Chemical Fiber Products in the First Half of 2024
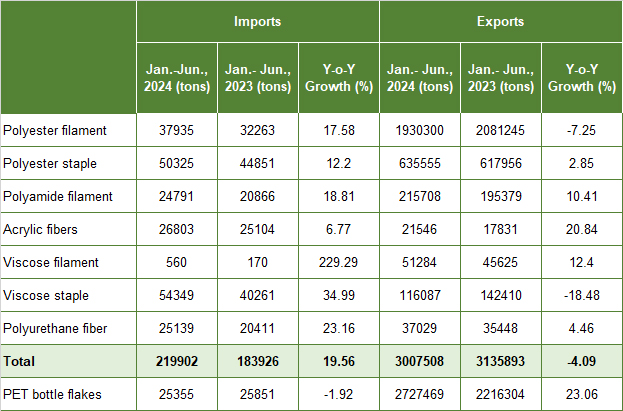
Source: Based on data from China Customs
IV. Revenue & Benefits
By sub-industry, polyester fiber and polyamide fiber are still the main contributors to the profit increment in the industry, contributing 60.2% and 12.3%, respectively, to the chemical fiber industry profit increment.
Table 3: Economic Benefit of Chemical Fiber and Related Industries in H1, 2024
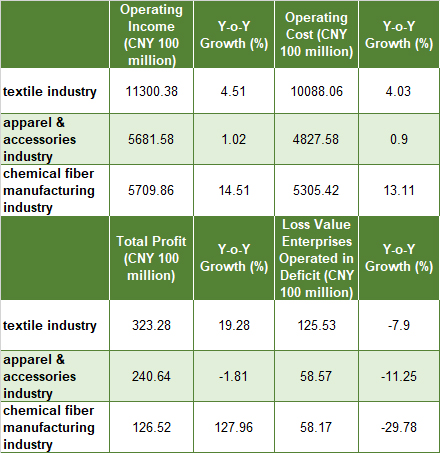
Source: National Bureau of Statistics
V. Fixed-assets Investment
According to the National Bureau of Statistics, the fixed-assets investment in the chemical fiber industry increased by 6.4% year-on-year in H1, while this figure was -7.0% in the same period in 2023. The investment growth rate rebounded under the low base effect. From the perspective of new production capacity, the new capacity of polyester fibers reached 800,000 tons/year; PET bottle flakes were still in the expansion cycle, with a new capacity of 2.7 million tons/year and 3.5 million tons/year to be invested.
Figure 2: Fixed-Assets Investment Growth of the Chemical Fiber Industry from 2008 to H1, 2024
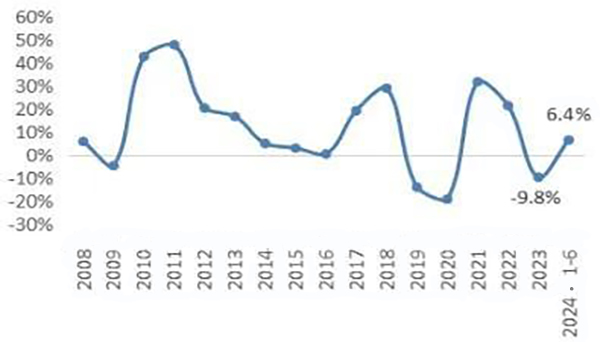
Source: National Bureau of Statistics
Source: CHINA TEXTILE LEADER Express


Authority in Charge: China National Textile and Apparel Council (CNTAC)
Sponsor: China Textile Information Center (CTIC)
ISSN 1003-3025 CN11-1714/TS

© 2026 China Textile Leader, all rights reserved.
Powered by SeekRay