2023/12/29
Overall, China’s knitting industry faced significant operating pressure in the first three quarters. The industry is experiencing a decline in production and sales due to the ongoing downturn in market demand, resulting in a decrease in international orders. Simultaneously, the Chinese economy persevered in its stabilization efforts, fostering the expansion of the domestic market and presenting a gradual amelioration in its development trajectory.
I. Production & Sales
According to the National Bureau of Statistics, in the first three quarters, the garment production of enterprises above designated size declined by 9.39% year-on-year. Thereinto, the production of knitted garments fell by 5.97% year-on-year, 0.68 percentage points narrower than the first half. The output of knitted garments accounted for 66.36% of the total, up 4.23 percentage points from 2022.
Industry revenue saw a slight improvement compared to that of the first half. From January to September, the main business income of knitting enterprises above designated size fell by 4.72% year-on-year, 1.47 percentage points narrower than that of the first quarter. Among them, the operating income of knitted fabrics enterprises above designated size increased by 0.11% year-on-year; that of knitted garments enterprises above designated size declined by 7.33% year-on-year.
Figure 1: The Production Growth Rate of China’s Knitting Industry, Q1-Q3, 2023
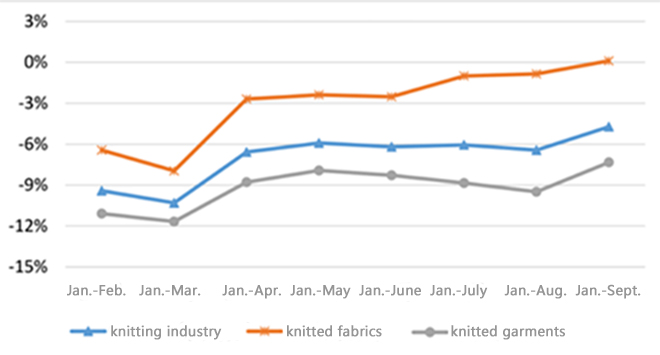
Source: National Bureau of Statistics
II. Profitability
From January to September, the total profits of knitting enterprises above designated size fell 6.6% year-on-year, 1.89 percentage points narrower than that of the first half. Knitted fabrics performed better than knitted garments. Their total profits fell by 3.82% and 7.81% year-on-year, respectively. Other main economic indicators are as follows.
Table 1: The Main Economic Indicators of Knitted Enterprises Above Designated Size, Q1-Q3, 2023
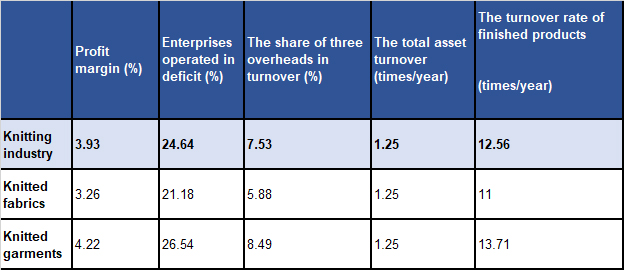
Source: National Bureau of Statistics
III. Foreign Trade
According to Chinese Customs data, China’s knitting industry exported US$ 79.22 billion worth of products in the first three quarters, down by 10.57% year-on-year. Among them, knitted fabric exports were US$ 16.41 billion, down 12.4% year-on-year; knitted garments and accessories exports reached US$ 62.81 billion, declining by 9.1% year-on-year. In September alone, China’s knitting industry exports decreased by 3.54% year-on-year.
Figure 2: Export Performance of China’s Knitting Industry in Q1-Q3, 2023
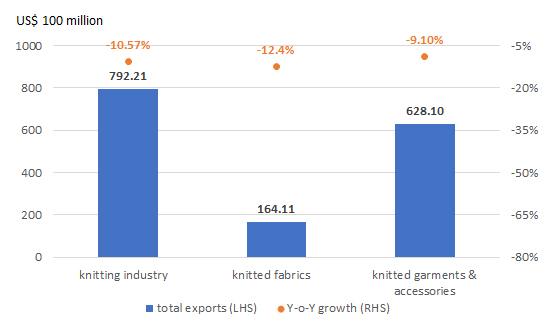
Source: China Customs
From the point of view of the main export markets, the export of China’s knitted products to major destination countries remains on a downward trajectory, similar to the rate of decrease observed in the first half of this year. ASEAN nations, excluding Brunei and Singapore, all experienced a significant decline. The exports of knitted goods from China to the United States have seen growth in the August-September period, indicating a rise in demand.
It is worth noting that China’s exports to Central Asia, the Middle East, Russia and other regions and countries expanded against headwinds. From January to September, there has been a significant year-on-year increase of 46.97% in China’s exports of knitted products to the five Central Asian countries. Additionally, exports to Russia have also seen a notable year-on-year growth of 25.99%. Moreover, exports to countries such as Turkey, Nigeria, and Brazil have also experienced a considerable rise in exports during this period.
Figure 3: Export Performance of China’s Knitted Products for Major Exports Destinations, Q1-Q3, 2023

Source: China Customs
By subcategories, most knitted products saw a year-on-year decline in their exports in the first nine months, and the exports of childrenswear, sportswear, and knitwear declined the most.
Table 2: Exports of Knitted Products by Category, Q1-Q3
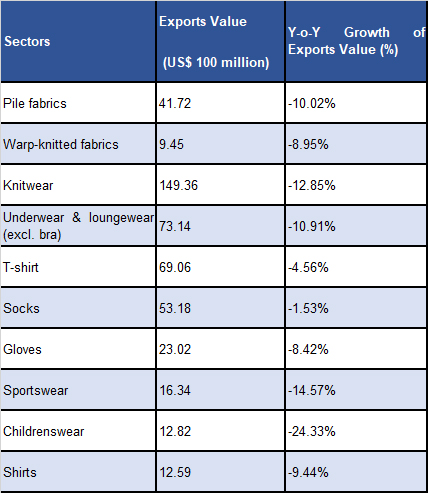
Source: China Customs
China aims to promote coordinated development between eastern and western provinces. As for the major textile provinces in eastern China, the export value of the five leading textile provinces, namely Zhejiang Province, Guangdong Province, Fujian Province, Jiangsu Province, and Shandong Province, all showed a year-on-year decrease during the first three quarters. And the exports of Xinjiang, Guangxi, Sichuan, Hubei and other central and western provinces and cities saw faster growth. In the forthcoming days, as the Belt and Road initiative continues to take effect, it will present numerous opportunities for China’s knitted products exports in the central and western regions.
Table 3: Knitted Products Exports of China’s Major Exporters, Q1-Q3, 2023
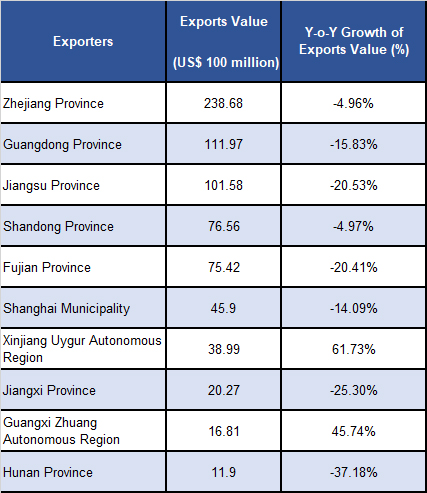
Source: China Customs
Figure 4: Export Share of Five Eastern Provinces and 19 Central and Western Provinces in China

Source: China Customs
As for the knitting machinery, according to China Customs, China exported more than 98,000 sets and 51,000 sets of circular knitting machines and warp knitting machines, respectively, in the first three quarters, down by 17.55% and 9.66% year-on-year. And China exported more than 55,000 sets of flatbed machines, seeing a sharp rise of 74.43% year-on-year.
Figure 5: Exports of China’s Knitting Machinery (Sets) in Q1-Q3, 2023

Source: China Customs
Source: CHINA TEXTILE LEADER Express


Authority in Charge: China National Textile and Apparel Council (CNTAC)
Sponsor: China Textile Information Center (CTIC)
ISSN 1003-3025 CN11-1714/TS

© 2026 China Textile Leader, all rights reserved.
Powered by SeekRay